Key performance indicators
Create custom KPIs and track metrics in real time for up-to-date information on process performance

Value driver diagnostic
Model key processes or the whole organisation with value driver trees that identify bottlenecks, inefficient operations and key value generators
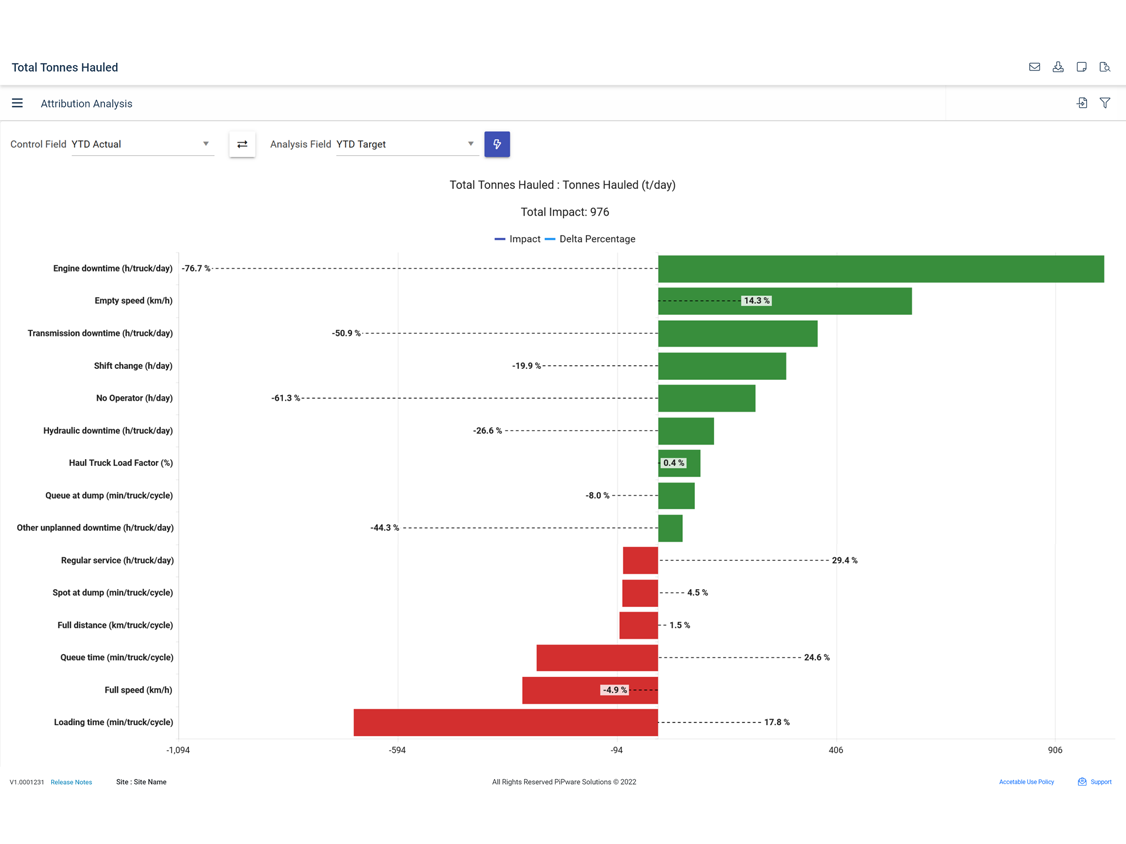
Value analysis
Run sensitivity, attribution or what-if analyses and uncover how changing KPIs drive value across your organisation

"WiredUp is a game changer. It provides us with better visibility on our KPIs and accountability for actions."
Iron Ore Mine
Senior General Manager

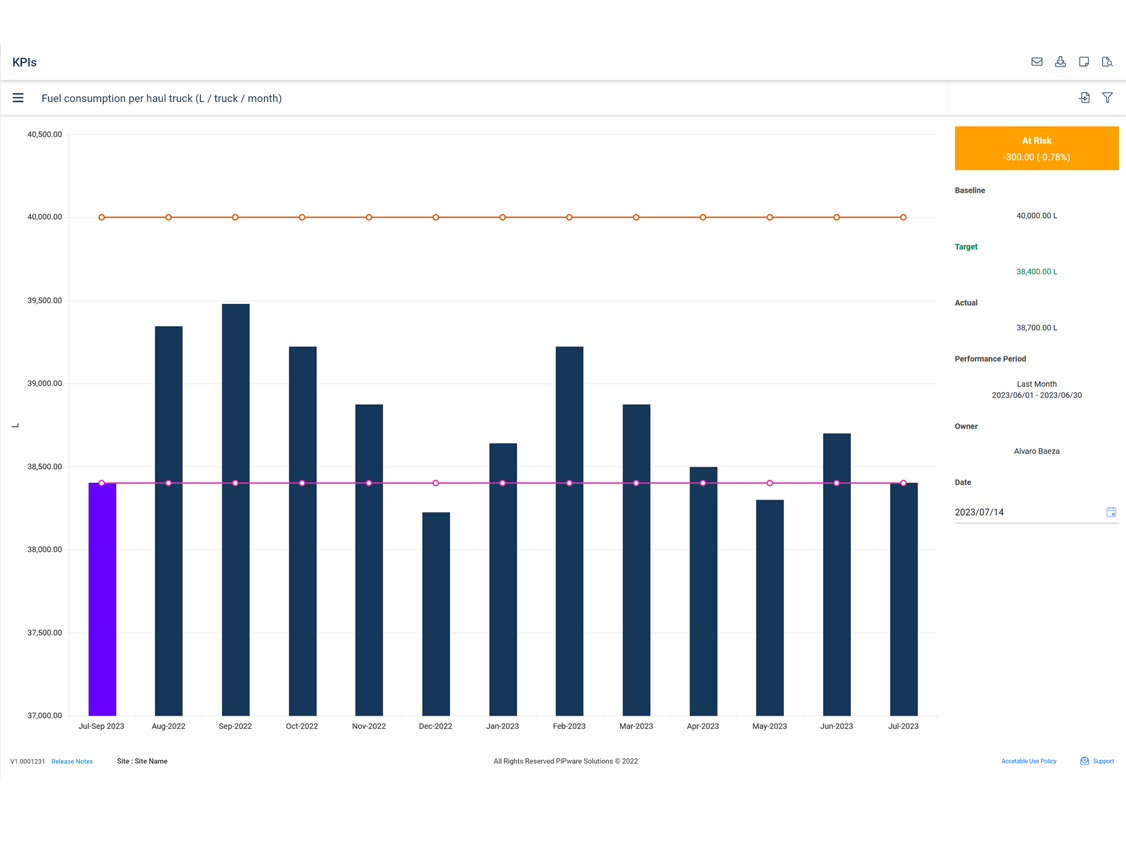
Track and manage key performance indicators
Empower your organisation to achieve goals by effectively tracking key metrics with custom KPIs. Whether you want to increase production or reduce downtime, WiredUp allows you to effortlessly set baseline or performance targets and revise them as needed with actuals data, giving you a clear eye on the performance of every process so you can leverage real-time measurements to fuel your organisation.
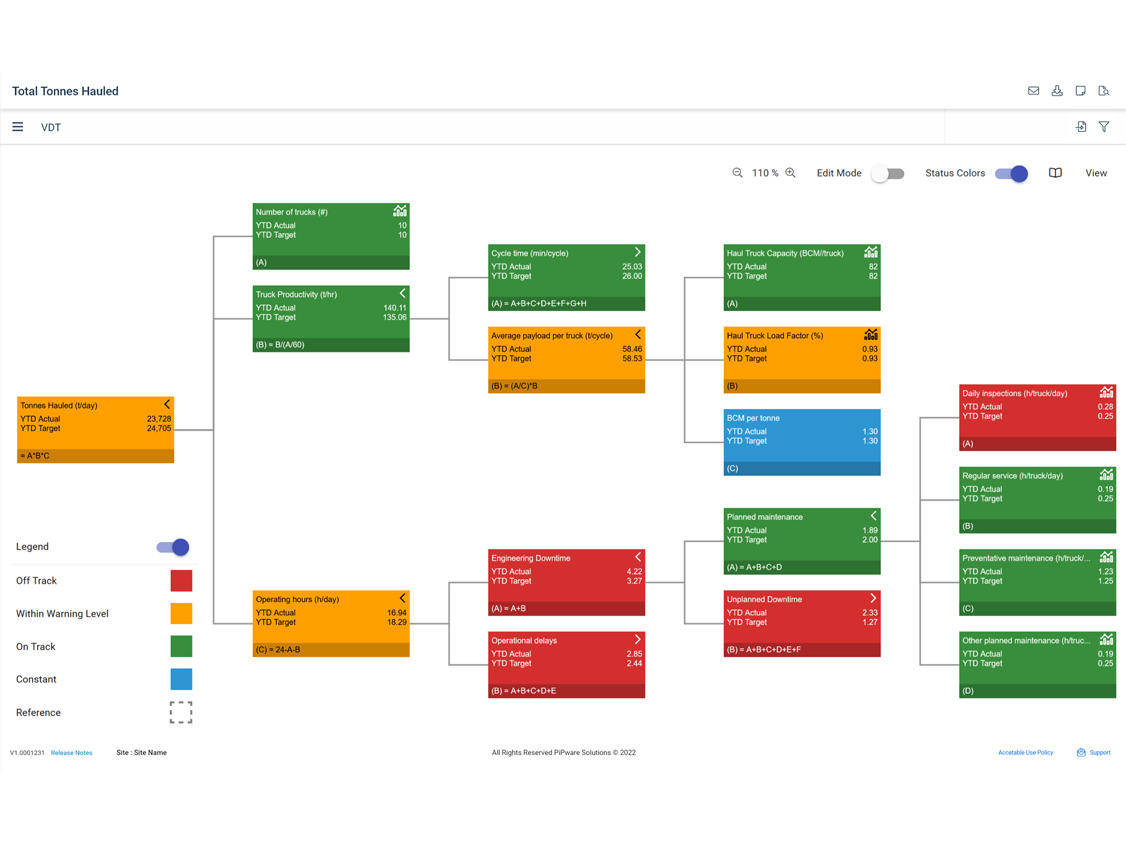
Track change with value driver trees
Map out workflows in your organisation with value driver trees (VDTs) to easily visualise every key process and link them to your KPIs. Track real-time performance measurements for specific processes or for your entire operations, enabling faster and more informed decision-making.
WiredUp’s user-friendly VDTs provide a clear and comprehensive view of your operations, accommodating thousands of nodes driven by different KPIs. They help you identify bottlenecks, inefficiencies and key value drivers, giving you a deeper insight into where to drive improvements in your organisation.
Improve processes through value analysis
Uncover new insights through advanced analytics (sensitivity, attribution and variance) applied to each VDT and see the impact changing KPIs have on value drivers across your organisation.
Every analysis uses up-to-date KPI values so you can identify the best levers to achieve your desired outcomes, whether it is to improve specific operations or to drive a global transformation. Explore them all below.
Uncover new ways to unleash potential
Explore different ways to analyse value drivers across your organisation
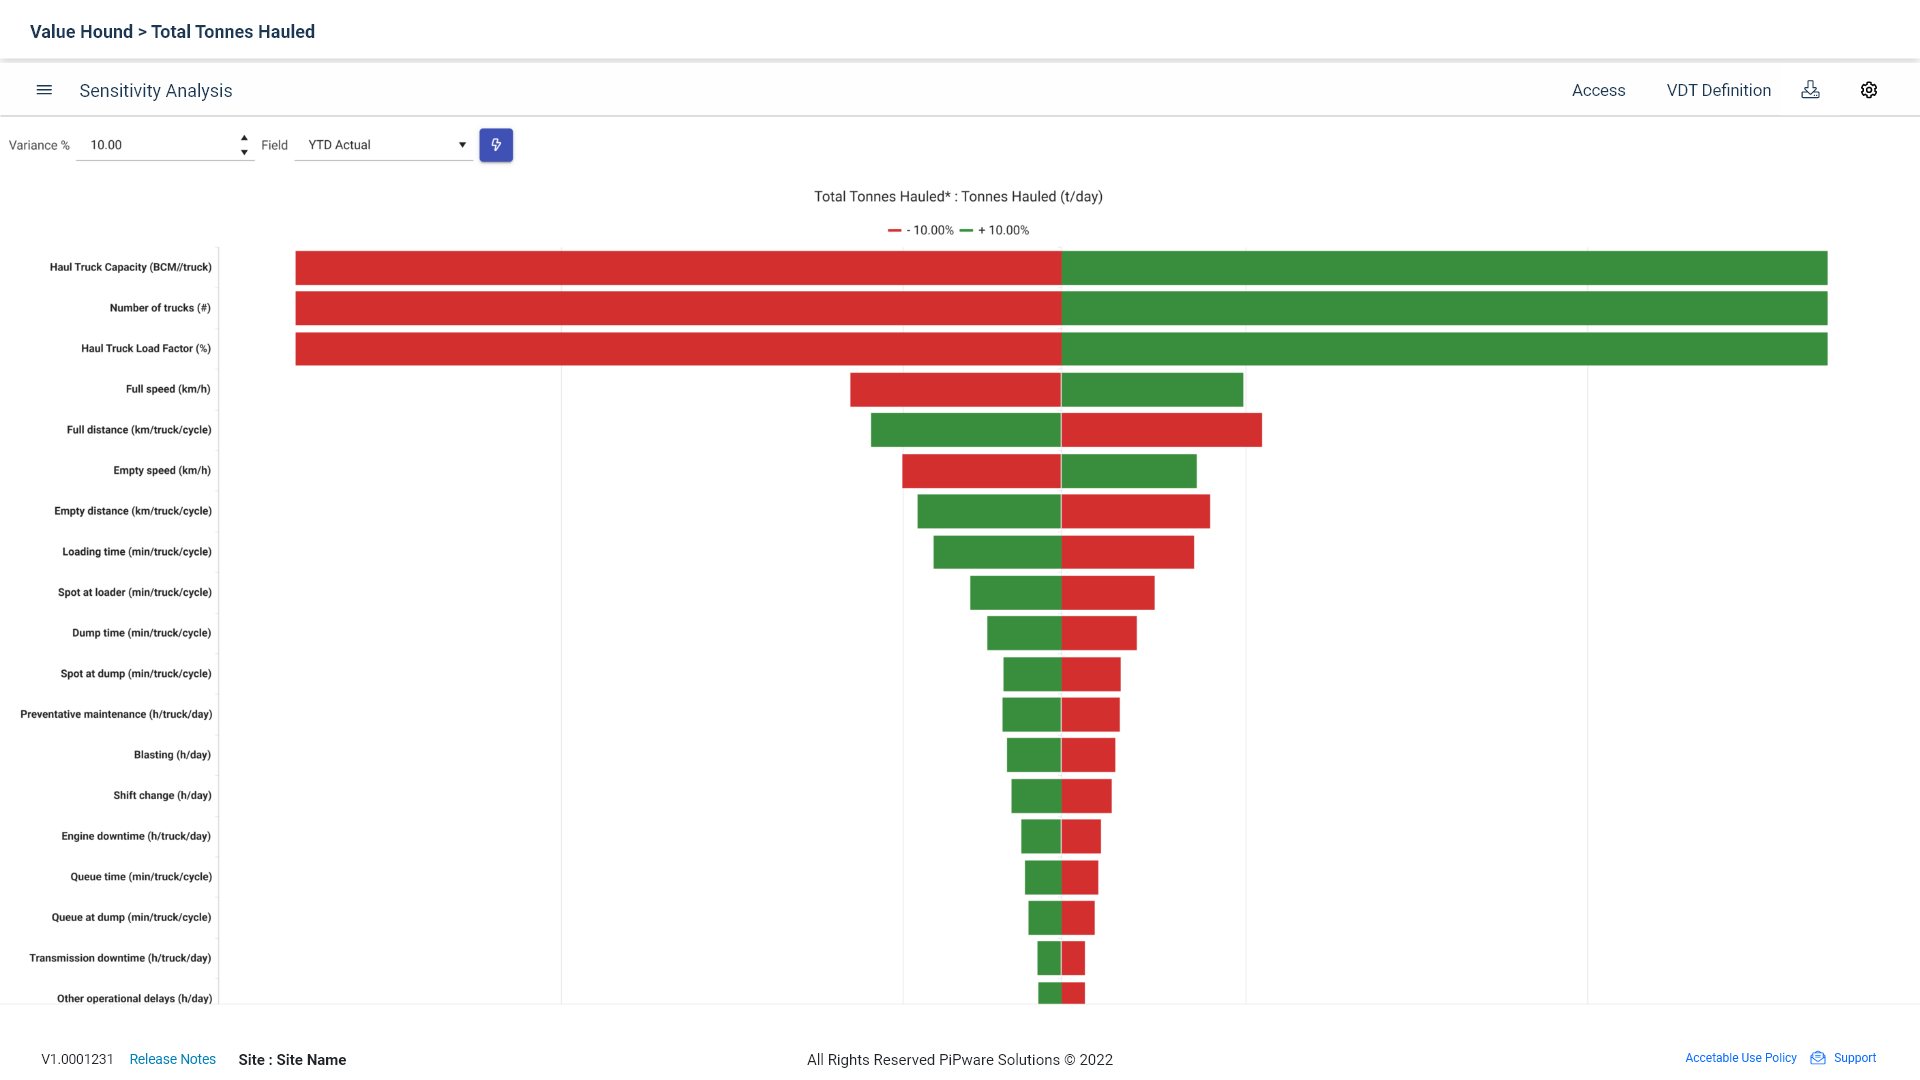
Sensitivity analysis helps you improve decision-making across your organisation by calculating which input KPI’s have the biggest impact on each business process model so you can see how each lever is affected when variance is introduced.
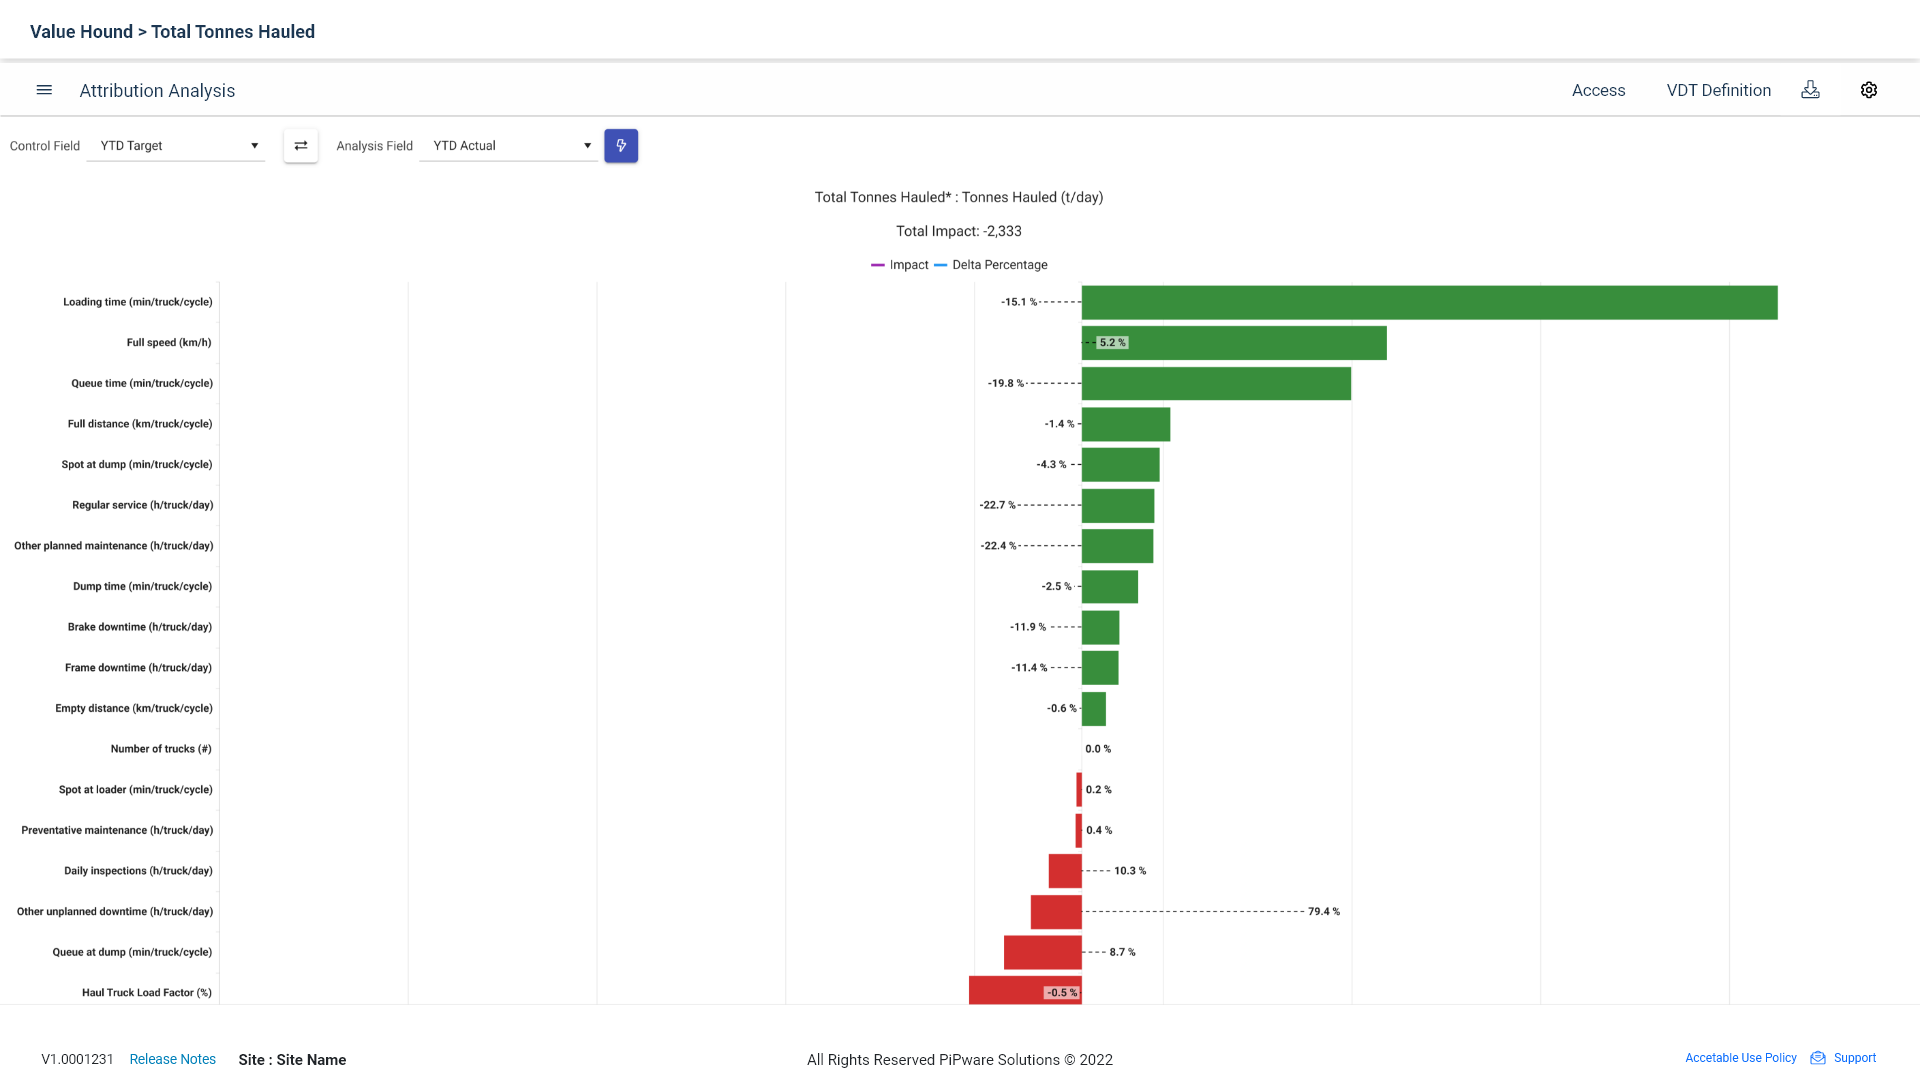
Identify performance and underperformance by comparing values across KPIs to determine how fluctuations impact value drivers. WiredUp’s attribution analysis allows you to compare control fields against analysis fields, giving you a better understanding of how business process model outcomes are affected by KPI variance.
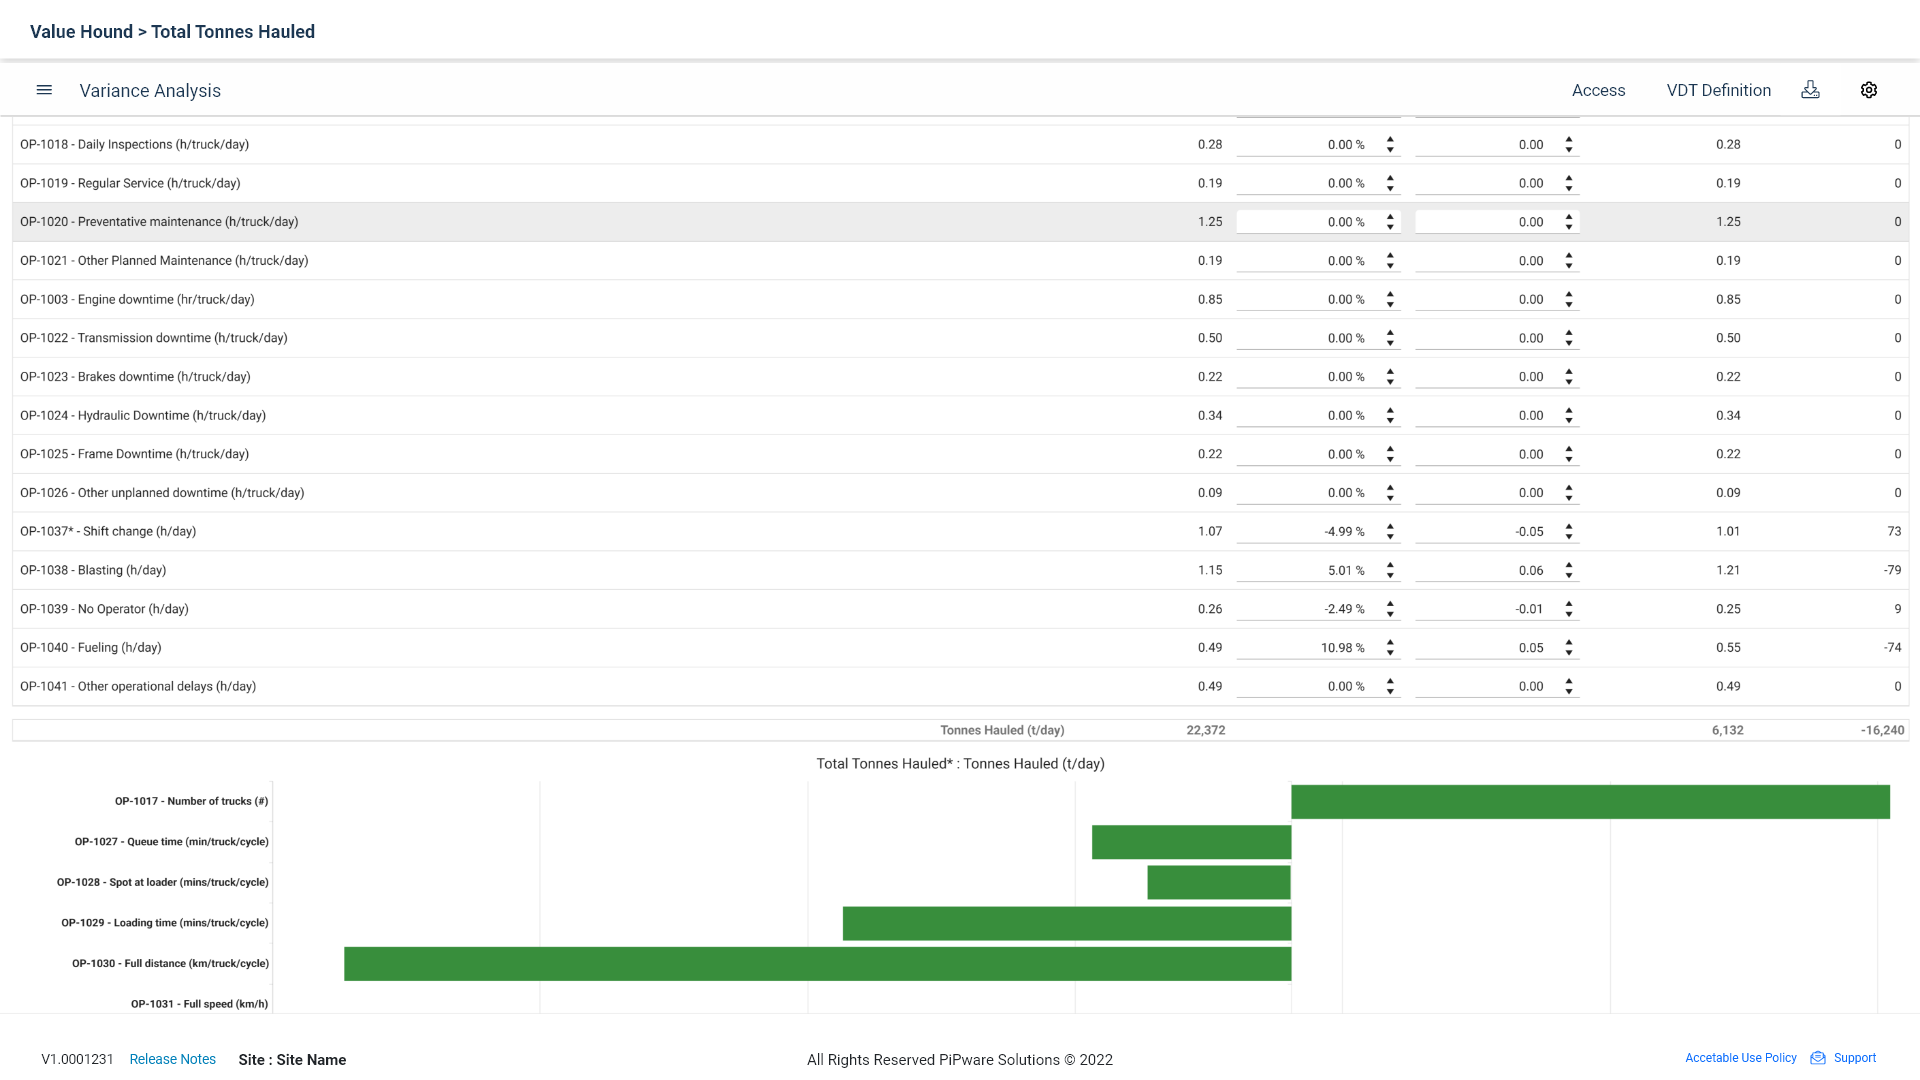
Uncover performance across your business by selecting individual percentage or absolute variance values per KPI and calculating how they impact the business process model outcome. This allows you to see the difference between planned and actual values, highlighting any areas which need attention or improvement.
Find out how WiredUp can help your organisation make a lasting impact